Neural-dynamical hybrid coupled model forecasts of the tropical
Pacific sea surface temperatures
Youmin Tang and William Hsieh
A new neural-dynamical hybrid coupled model has been developed for
giving seasonal predictions of the tropical Pacific sea surface
temperatures. A 6-layer dynamical ocean model of the tropical Pacific is
driven by the FSU wind stress; then during the forecasting period (Tang and Hsieh,
2001a), the ocean model is coupled to a nonlinear neural network
atmospheric model, which estimates the surface wind stress anomalies from the
upper ocean heat content anomalies (Tang et al, 2001).
For better forecast skills, different types of data-- surface wind
stress, upper ocean heat content anomaly (HCA) (White, 1995), sea
surface temperature (SST) and sea surface height anomaly-- have been
assimilated into the coupled model using a 3D-Var data assimilation
scheme (Derber and Rosati, 1989). The results show that assimilating
HCA (kindly provided by Warren White and Ted Walker at SIO) yields the
greatest improvement in the forecast correlation skills (Tang and Hsieh,
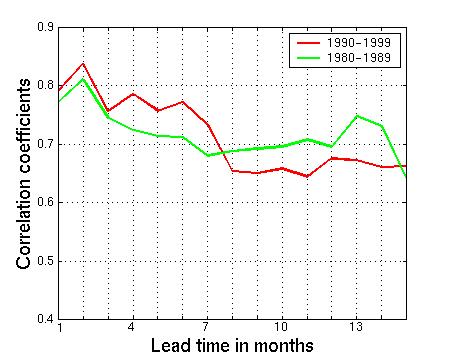
2001b). Fig. 1 shows the correlation skills of the predicted SST
anomalies (SSTA) in the NINO3 region (5S-5N, 150W-90W) in the equatorial
eastern Pacific during 1980-1989 and 1990-1999 using our model with HCA
assimilation. The predictions were made at three months intervals
(starting on 1 January, 1 April, 1 July and 1 October) and continued
until a lead time of 15 months.
Fig.1 Correlation skills of the predicted NINO3 SSTA.

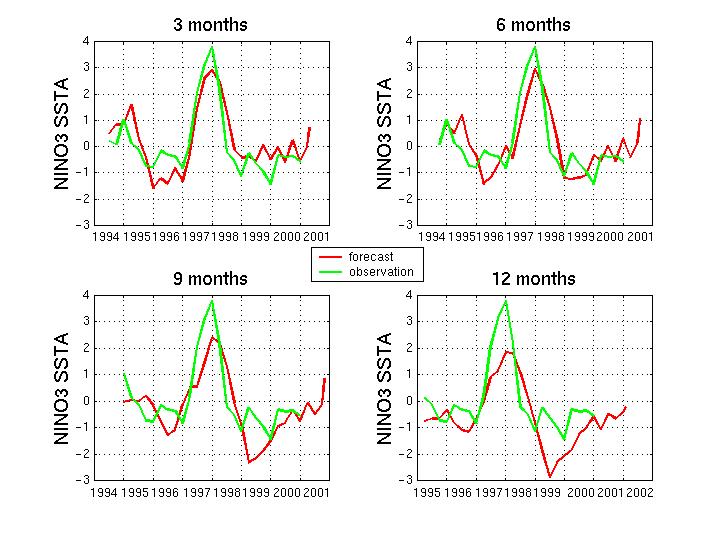
Fig.2 Observed and predicted NINO3 SSTA at lead times of 3, 6, 9 and 12
months.

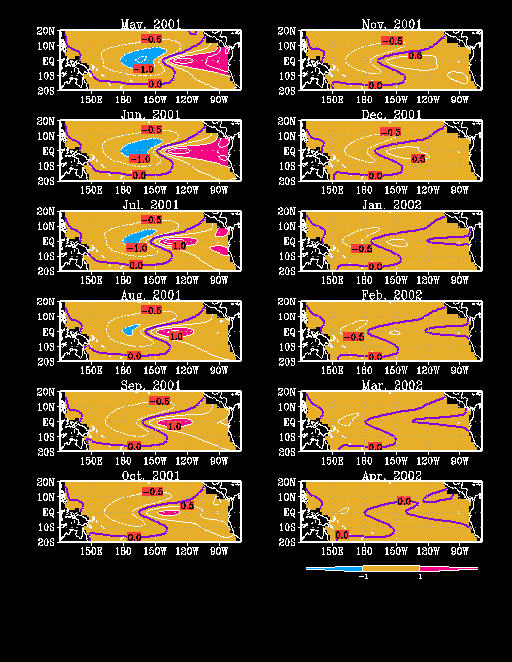
Fig 3 shows our latest forecasts (initialized using data till the end of
February, 2001), indicating that the moderate cool anomalies in the
western equatorial Pacific and the moderate warm anomalies in the
eastern equatorial Pacific present during late spring, 2001, will
gradually fade away to near normal conditions by November, 2001, and
remaining near normal till spring, 2002.
Fig.3 Predicted SSTA of the tropical Pacific.
Contour intervals are 0.5 degree Celsius. Positive anomalies above 1
degree are shaded in red, and negative anomalies below -1 degree are in
blue. The zero contour is in purple.

References:
Derber, J. and A. Rosati, 1989: A global oceanic data assimilation
system. J. Phys. Oceanogr., 19, 1333-1347.
Tang, Y., and W. W. Hsieh, B. Tang and K. Haines, 2001: A neural
network atmospheric model for hybrid coupled modelling. Clim.
Dynam., 17, 445-455.
Tang, Y. and W.W. Hsieh, 2001a: Hybrid coupled models of the
tropical Pacific -- ENSO prediction. Clim. Dynam. (submitted).
[http://www.ocgy.ubc.ca/~william/pubs.html]
Tang, Y. and W. W. Hsieh, 2001b: Impact of data assimilation on
ENSO simulations and predictions. J. of Climate (submitted).
[http://www.ocgy.ubc.ca/~william/pubs.html]
White, W.B., 1995: Design of a global observing system for gyre-scale
upper ocean temperature variability. Prog. in Oceanogr., 36,
169-217.


