Nonlinear canonical correlation analysis
forecasts of the tropical Pacific sea surface temperatures
Aiming Wu and William W. Hsieh
Using data up to the end of
August, 2003,
forecasts were made with the
nonlinear canonical correlation analysis model
approach. Ensemble-averaged forecasts for the sea surface temperature
anomalies (SSTA) in the Nino3.4 region
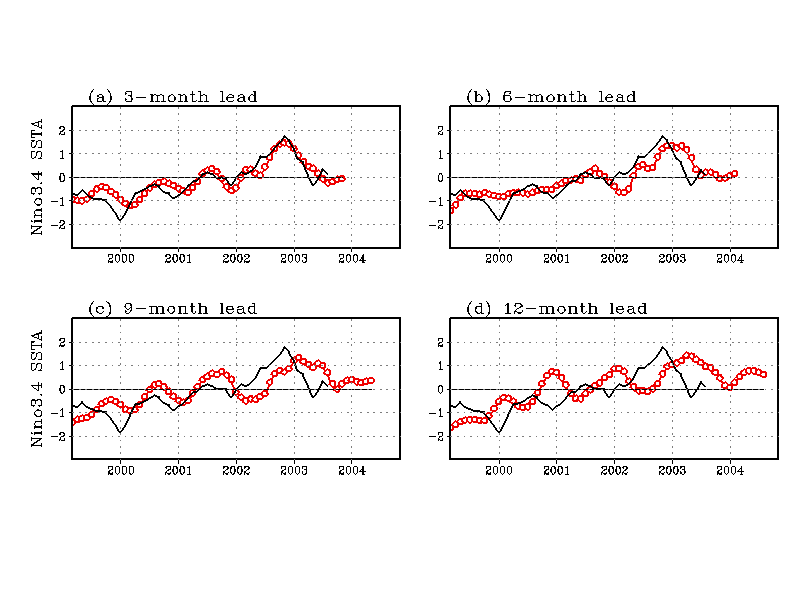
at various lead times are shown in Fig.1, showing
near normal conditions for the winter of
2003-2004. The forecasted SSTA
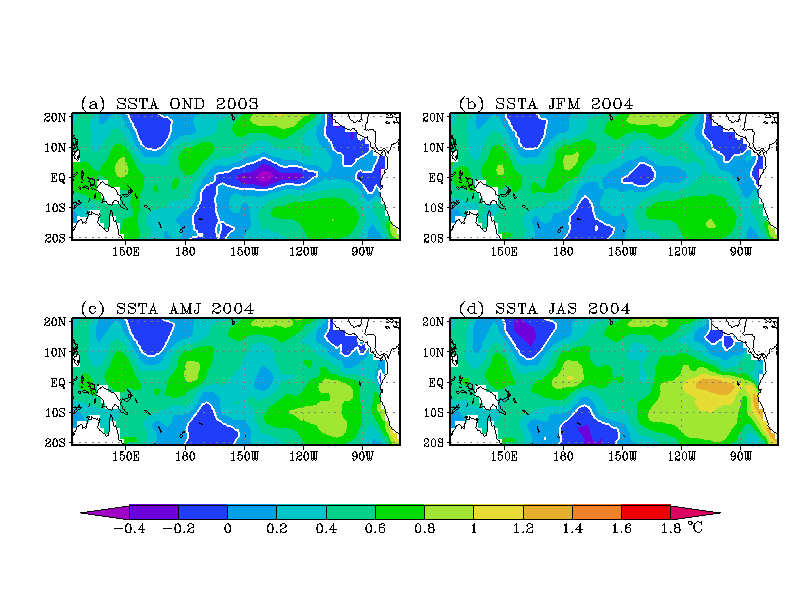
fields over the tropical Pacific are shown in Fig.2.
Figure 1. The SSTA (in degree Celsius) in the Nino3.4
area (170W-120W,5S-5N) predicted by the ensemble-averaged nonlinear
model at 3, 6, 9 and 12 months of lead time (circles), with
observations denoted by the solid line. Tick marks along the abscissa
indicate the January of the given years.
(The postscript file of Fig.1 is also available).

Figure 2. SSTA (in degrees Celsius) predicted by the ensemble-averaged
nonlinear model at 3, 6, 9 and 12 months of lead time, corresponding to
the four consecutive seasons starting with
OND (October, 2003- December, 2003).
The zero contour is shown as a white curve.
(The postscript file of Fig.2 is also available).

Back to [UBC Climate Prediction Group Home
Page]


